Canada vs Australia: Population - Wages - Prices - Cost of Living - Tax Burden - House Prices
The Race of the Commodity Exporting Country
Canada Compared with Australia
Population — Wages — Prices — Cost of Living — Tax Burden — House Prices

Canada and Australia are the two largest countries that select potential skilled immigrants using a points system.
Both countries have an enviable reputation as places where people enjoy a high quality of life and a high standard of living.
Both also withstood the financial turmoil of the last few years better than most.
Each has large reserves of minerals and, in Canada’s case oil. As worldwide demand for commodities has risen, so have the economic prospects of Australia and Canada.
We put these countries head-to-head, to see how they measure up on a number of measures including wages, house prices, taxes, unemployment, net inward migration rate, and climate.
Canada vs Australia
| Canada | Australia | |
|---|---|---|
| Area | 9.98 million sq km | 7.69 million sq km |
| Estimated Population 2012 | 34.3 million | 22 million |
| Largest City | Toronto (pop. 2.7 million) | Sydney (pop. 4.5 million) |
| Net migration rate in 2012 | 5.65 arrivals per 1,000 population | 5.93 arrivals per 1,000 population |
| Proportion of population born overseas | 20 percent | 24 percent |
| Ethnic Groups | European 66%, Amerindian 2%, other 6%, mixed background 26% | White 92%, Asian 7%, Aboriginal, other 1% |
| GDP Per Person (Purchasing Power Parity) 2011 | US$40,300 | US$40,800 |
| Average Weekly Earnings 2010 (All ages of workers, full-time and part-time, including overtime) | Can$848 per week | Aus$1010 per week |
| Average Weekly Earnings 2010 converted to US$ | US$854 per week | US$1072 per week |
| Minimum Wage (per hour) 2011/2012 | Varies from Can$9.00 per hour in Yukon to Can$11 per hour in Nunavut | Federal Minimum Aus$15.51 |
| Unemployment Rate (Early 2012) | 7.6% | 5.2% |
| Cost of Living Ranking (Mercer cost of living survey 2011) The lower the ranking, the higher the cost of living. | Toronto 59th; Vancouver 65th; Montreal 79th; Calgary 96th | Sydney 14th; Melbourne 21st; Perth 30th; Brisbane 34th |
| Homicide Rate 2010 | 1.62 per 100,000 people | 1.1 per 100,000 people |
| Tax Freedom Day † 2011 | 6 June | 6 April |
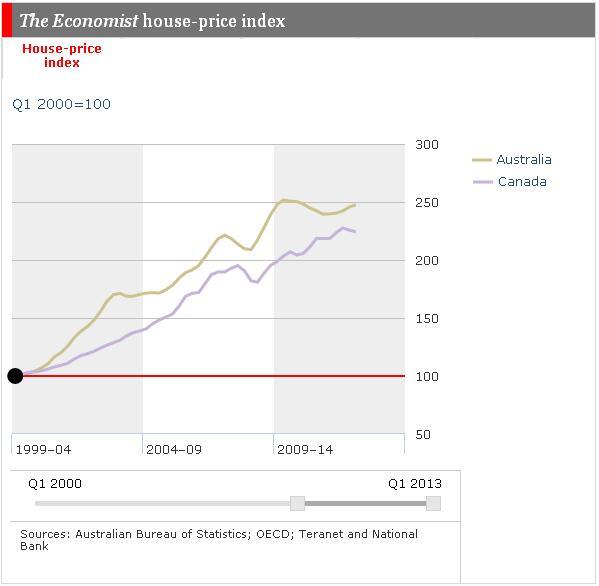
| Average Home Price (Early 2012) | Can$348,000 | Aus$533,000 |
| Average Home Price converted to US$ (Early 2012) | $350,000 | $565,000 |
| Life expectancy at birth (males, 2012 est.) | 78.89 years | 79.48 years |
| Life expectancy at birth (females, 2012 est.) | 84.21 years | 84.45 years |
| Typical Climates | Temperate, semi-continental, continental, prairie, polar | Temperate, mediterranean, sub-tropical, tropical, desert |
† Tax freedom day is the day each year when the average income earner has paid all taxes to government and gets to keep all their income. The earlier the date, the lower the tax burden on the average citizen.
References


Comments
Post a Comment